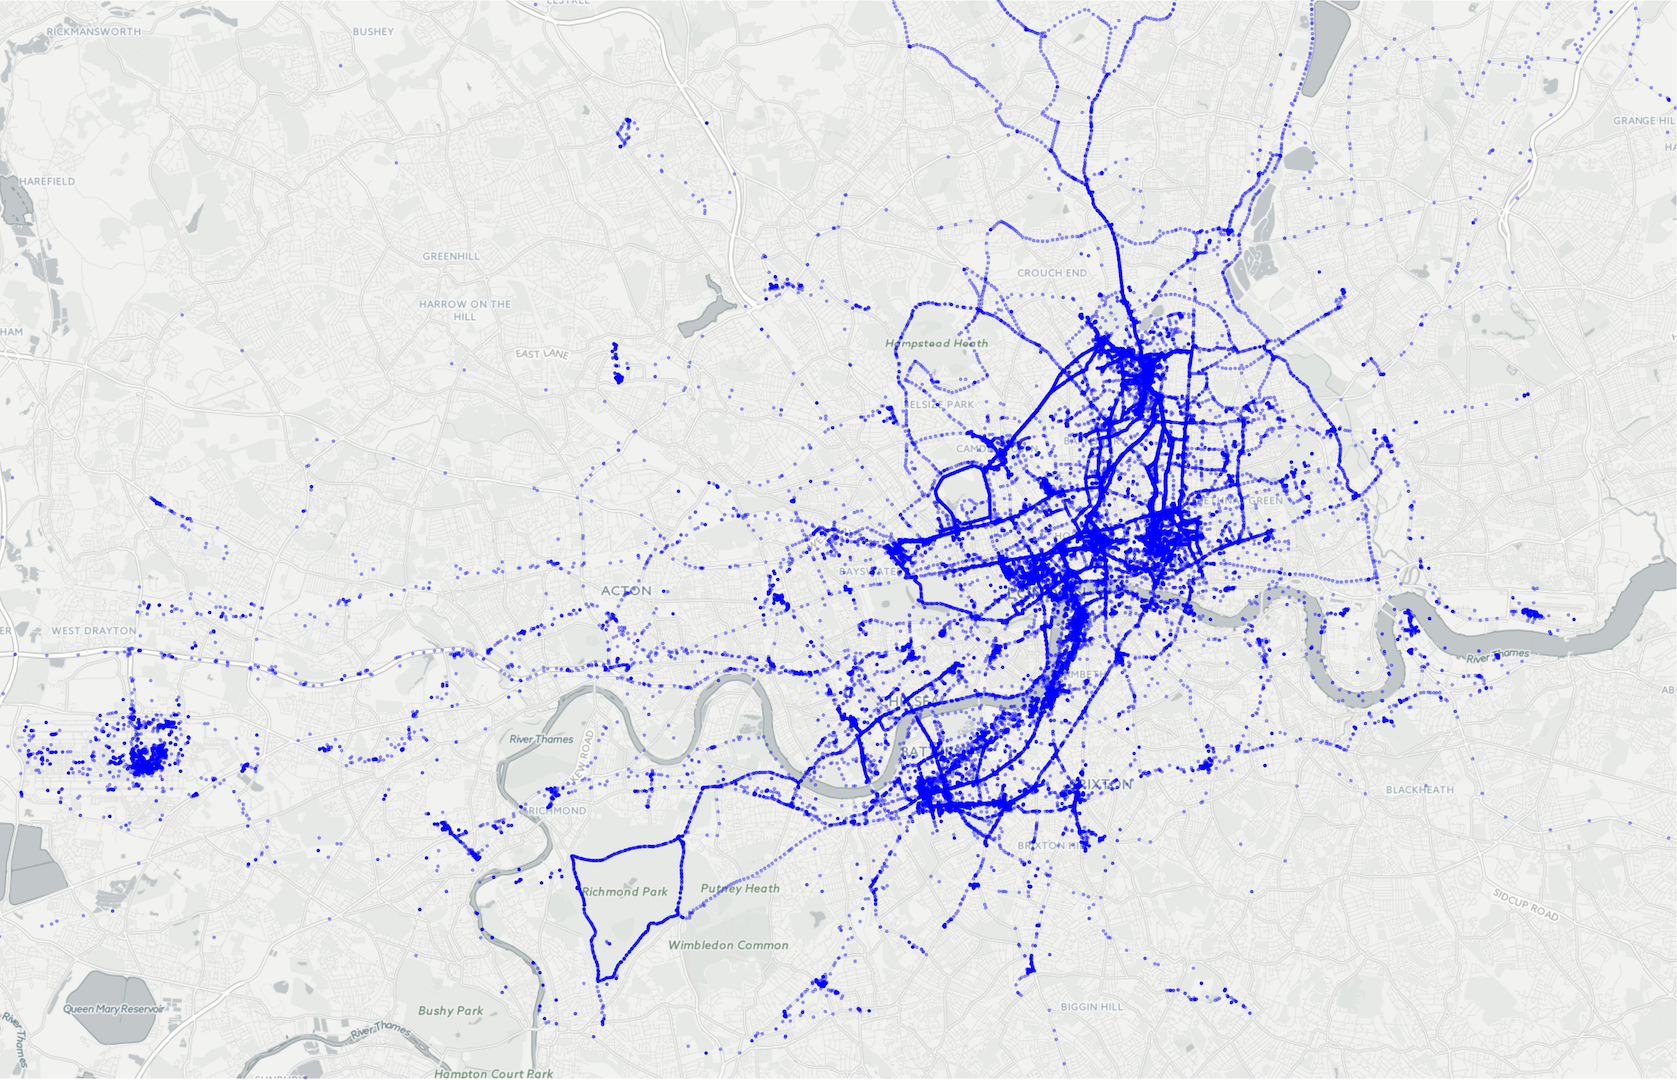
Mapping 3 years in London with R
Back in 2009, Google introduced Latitude to allow users to share their location with friends. It was explicitly opt-in but included a feature to record your Location History. Today, most people opt-in when they setup their Android devices and are prompted to ‘enhance their Google Maps experience’. If you’re curious how much data your phone has collected head over to the Google Maps Timeline.
I’ve been opted-in since 2012, and while I’ve known my phone was collecting this information I never thought about it very much. Playing around with this data over the last few days has opened my eyes somewhat to how weird it really is that someone knows this much about me. Google allows you to delete your own data, but I don’t really want to trash all this information, I’d just like to have more control over it.
Enter Takeout. Takeout is a tool Google has been quietly building over the last few years to allow users to liberate their own data. For the most part there aren’t off the shelf solutions for doing things with this data so you just end up with a large zip sitting around somewhere.
Over the holidays I’ve been looking into ways to archive my electronic footprint in a way that is useful. I have some rough ideas on how I want to do this and as part of validating those I wanted to experiment with doing something to visualise some of that data. At the same time I’ve been wanting a little project to learn R so inspired by various content on /r/dataisbeautiful I set off to turn my three years of living in London into something pretty.
After a few hours of waiting for Google to package my location data up for me I had a 300MB JSON file sitting on my laptop. The data is in a relatively straight-forward format, essentially a large (~1.3M) list of data points in a fairly simple format:
{
  "timestampMs" : "1483454433636",
  "latitudeE7" : 515568326,
  "longitudeE7" : -902568,
  "accuracy" : 50
}
JSON is great for portability, but is sufficiently lacking when you want to manipulate large volumes of data so my first step is to import this into InfluxDB. Any database you can run on your computer should be able to handle a dataset of this size, Influx just happens to be something else I’m trying to learn more about.
Before importing the data I spent a few minutes poking around in a text editor where I noticed a few things:
- Some data points also include ‘activity’ information where Google has tried to infer a mode of transport from other info. I don’t care about that information.
- The co-ordinates are stored as ‘E7’ integers, presumably because of precision conerns. I transform these back to floating point values.
Here’s the script I used to import the data:
One of the advantages of having this data in a database is how easily you can query the data. It becomes trivial to answer questions like these:
- How many data points are there per day? -> ~600-800/day (max ~1600/day)
- How many data points are in London vs not? -> ~79% in 2014, ~68% in 2015, ~77% in 2016
One thing I did learn in the process is that InfluxDB still lacks many of the features provided by more mature databases such as PostgreSQL and MySQL. It only supports GROUP BY <tag> and GROUP BY time(interval). While intervals can be some finite number of seconds, it lacks the ability to group on month or year.
From here, I want to do something with the data in R. It turns out that the official influxdb module doesn’t support version 0.9+ so we need to use an alternative version from github/sischnei. Once thats out of the way we can leverage R to create a map for us.
Before writing that script I spent some time running through a basic introduction to the language I found on google. Because the documentation for the mapping features assumes a fairly substantial knowledge of the language I figured most of this script out with trial and error in RStudio. Some of this was frustratingly slow, but I suspect that once I figure out why I needed to re-render everything rather than testing iteratively this becomes less of a hassle.
And here’s the result.